From Splunk Command Line Reference:
http://docs.splunk.com/Documentation/Splunk/latest/Admin/AccessandusetheCLIonaremoteserver
Note: the CLI may ask you to authenticate – it’s asking for the LOCAL credentials, so if you haven’t changed the admin password on the forwarder, you should use admin/changeme
Steps for Installing/Configuring Linux forwarders:
Step 1: Download Splunk Universal Forwarder: http://www.splunk.com/download/universalforwarder (64bit package if applicable!). You will have to create an account to download any piece of Splunk software
Step 2: Install Forwarder
tar -xvf splunkforwarder-6.6.3-e21ee54bc796-Linux-x86_64.tgz -C /opt
It will install the splunk code in /opt/splunforwarder directory
Step 3: Enable boot-start/init script:
/opt/splunkforwarder/bin/splunk enable boot-start
(start splunk: /opt/splunkforwarder/splunk start)
Step 4: Enable Receiving input on the Index Server
Configure the Splunk Index Server to receive data, either in the manager:
- using the web GUI : Manager -> sending and receiving -> configure receiving -> new
- using the CLI:
/opt/splunk/bin/splunk enable listen 9997
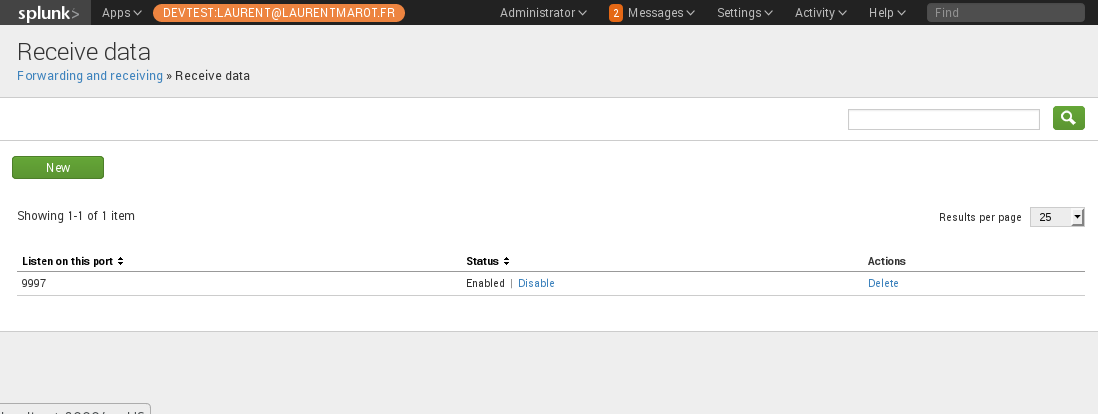
Enable receiving on Iddexer
Where 9997 (default) is the receiving port for Splunk Forwarder connections
Step 5: Configure Forwarder connection to Index Server:
/opt/splunkforwarder/bin/splunk add forward-server hostname.domain:9997
(where hostname.domain is the fully qualified address or IP of the index server (like indexer.splunk.com), and 9997 is the receiving port you create on the Indexer
Step 6: Test Forwarder connection:
/opt/splunkforwarder/bin/splunk list forward-server
Step 7: Add Data:
/opt/splunkforwarder/bin/splunk add monitor /path/to/app/logs/ -index main -sourcetype %app%
Where
/path/to/app/logs/ is the path to application logs on the host that you want to bring into Splunk,
%app% is the name you want to associate with that type of data
This will create a file: inputs.conf in /opt/splunkforwarder/etc/apps/search/local/
— here is some documentation on inputs.conf: http://docs.splunk.com/Documentation/Splunk/latest/admin/Inputsconf
Note: System logs in /var/log/ are covered in the configuration part of Step 7. If you have application logs in /var/log/*/
Step 8 (Optional): Install and Configure UNIX app on Indexer and nix forwarders:
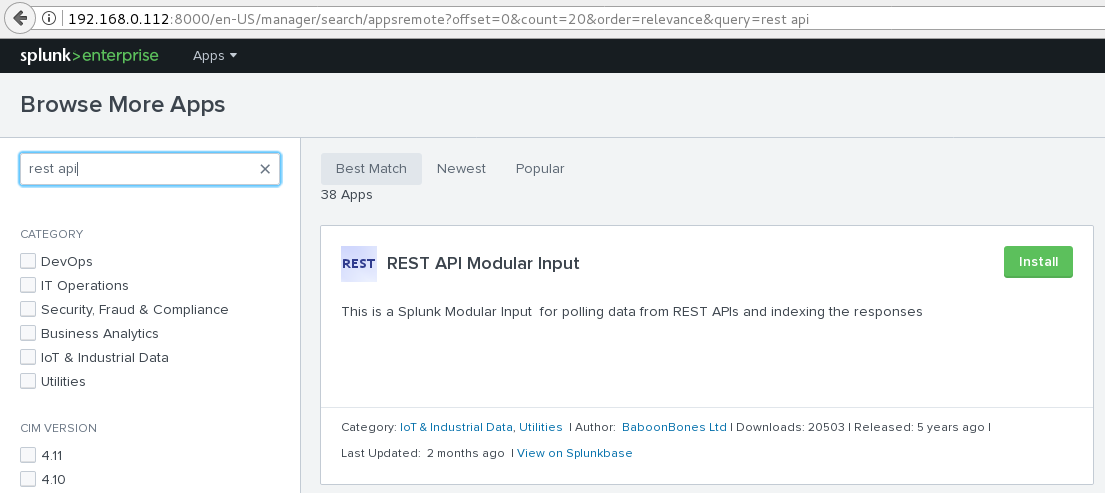
On the Splunk Indexer, go to Apps -> Manage Apps -> Find more Apps Online -> Search for ‘Splunk App for Unix and Linux’ -> Install the « Splunk App for Unix and Linux’ Restart Splunk if prompted, Open UNIX app -> Configure
Once you’ve configured the UNIX app on the server, you’ll want to install the related Add-on: « Splunk Add-on for Unix and Linux » on the Universal Forwarder.
Go to http://apps.splunk.com/ and find the « Splunk Add-on for Unix and Linux » (Note you want the ADD-ON, not the APP – there is a big difference!).
Copy the contents of the Add-On zip file to the Universal Forwarder, in: /opt/splunkforwarder/etc/apps/.
If done correctly, you will have the directory « /opt/splunkforwarder/etc/apps/Splunk_TA_nix » and inside it will be a few directories along with a README & license files.
Restart the Splunk forwarder (/opt/splunkforwarder/bin/splunk restart)
Note: The data collected by the unix app is by default placed into a separate index called ‘os’ so it will not be searchable within splunk unless you either go through the UNIX app, or include the following in your search query: “index=os” or “index=os OR index=main” (don’t paste doublequotes).
You also will have to install sysstat if you want to monitor your server resources.
Step 9 (Optional): Customize UNIX app configuration on forwarders:
Look at inputs.conf in /opt/splunkforwarder/etc/apps/unix/local/ and /opt/splunkforwarder/etc/apps/unix/default/ The ~default/inputs. path shows what the app can do, but everything is disabled.
The ~local/inputs.conf shows what has been enabled – if you want to change polling intervals or disable certain scripts, make the changes in ~local/inputs.conf.
Step 10 (Optional): Configure File System Change Monitoring (for configuration files): http://docs.splunk.com/Documentation/Splunk/4.3.2/Data/Monitorchangestoyourfilesystem
Note that Splunk also has a centralized configuration management server called Deployment Server. This can be used to define server classes and push out specific apps and configurations to those classes. So you may want to have your production servers class have the unix app configured to execute those scripts listed in ~local/inputs at the default values, but maybe your QA servers only need a few of the full stack, and at longer polling intervals.
Using Deployment Server, you can configure these classes, configure the app once centrally, and push the appropriate app/configuration to the right systems.
Enjoy !
Need Help troubleshooting ?
Do the same on Microsoft Windows Platform : click, click, click …
Splunk official how-to on that part: http://docs.splunk.com/Documentation/Splunk/6.2.3/Data/Useforwardingagentstogetdata